RSM Scorecard Setup Flow
The Responsibility Social Management system helps our client assess and benchmark their supplier chain's sustainability performance. My team of developers was tasked to design and build Scorecard, a new questionnaire system that gathers ESG (Environmental Social Governance) data from suppliers, and informs them of the auditing results through a report.
Note: Due to confidentiality issues, this page will focus on the user experience design of the system. Information will be processed and obscured, and I am unable to provide the link to the website.
Objective
Migrating Manual Processes to the RSM System
The client originally performed their tasks of sending questionnaires, receiving and auditing responses and sending reports through a lot of manual work and emails back and forth with Excels and PDFs. Our main target was to integrate their original workflow into the new RSM system in a systematic manner and reduce the manual and mental load.
Research
Exploring User Needs & Design Strategy
To understand how we should design Scorecard, we conducted a multifaceted research approach:
- User interviews: Identifying the scope, user needs, workflows and project timeframe.
- Study existing artifacts: Understand the required contents through analyzing our client's materials.
- Analyze similar products: Help design interactions from established products to facilitate user comprehension and ensure usability.
Challenges
How Might We Migrate the Process Without Changing the Current Paradigm?
Most users have adhered to their established methods for a long time, and our client wanted the new system to align with their practices. This required a lot of flexibility since their previous processes were largely designed and handled manually. The main challenges we faced, such as dealing with complex structures and workflows, stemmed from such flexibiliy.
Supporting cross-year analysis
As data was moveable between different files, our new system should be able to support such feature as well.
Lessening the burden of structural complexity
Many of their designs and workflows had very complex calculations and procedures, and we wanted to shift some of the burden to the new system.
Maintaining system flexibility
While the new system should approach RSM in a systematic manner, many manual controls should be maintained to fit the user's habits.
Crafting an intuitive flow for suppliers
Unlike our client, their suppliers generally only use the webiste once per year. The new update should be intuitive for them to use and help them transition without abandoning old methods.
Ideation
Connecting Features
We worked closely with the client to ensure we met all their requirements while we considered the technical feasibility of the designs, and developed the setup flow of the system with the relationships between the different features.
Design Outcome
Wireframe Designs
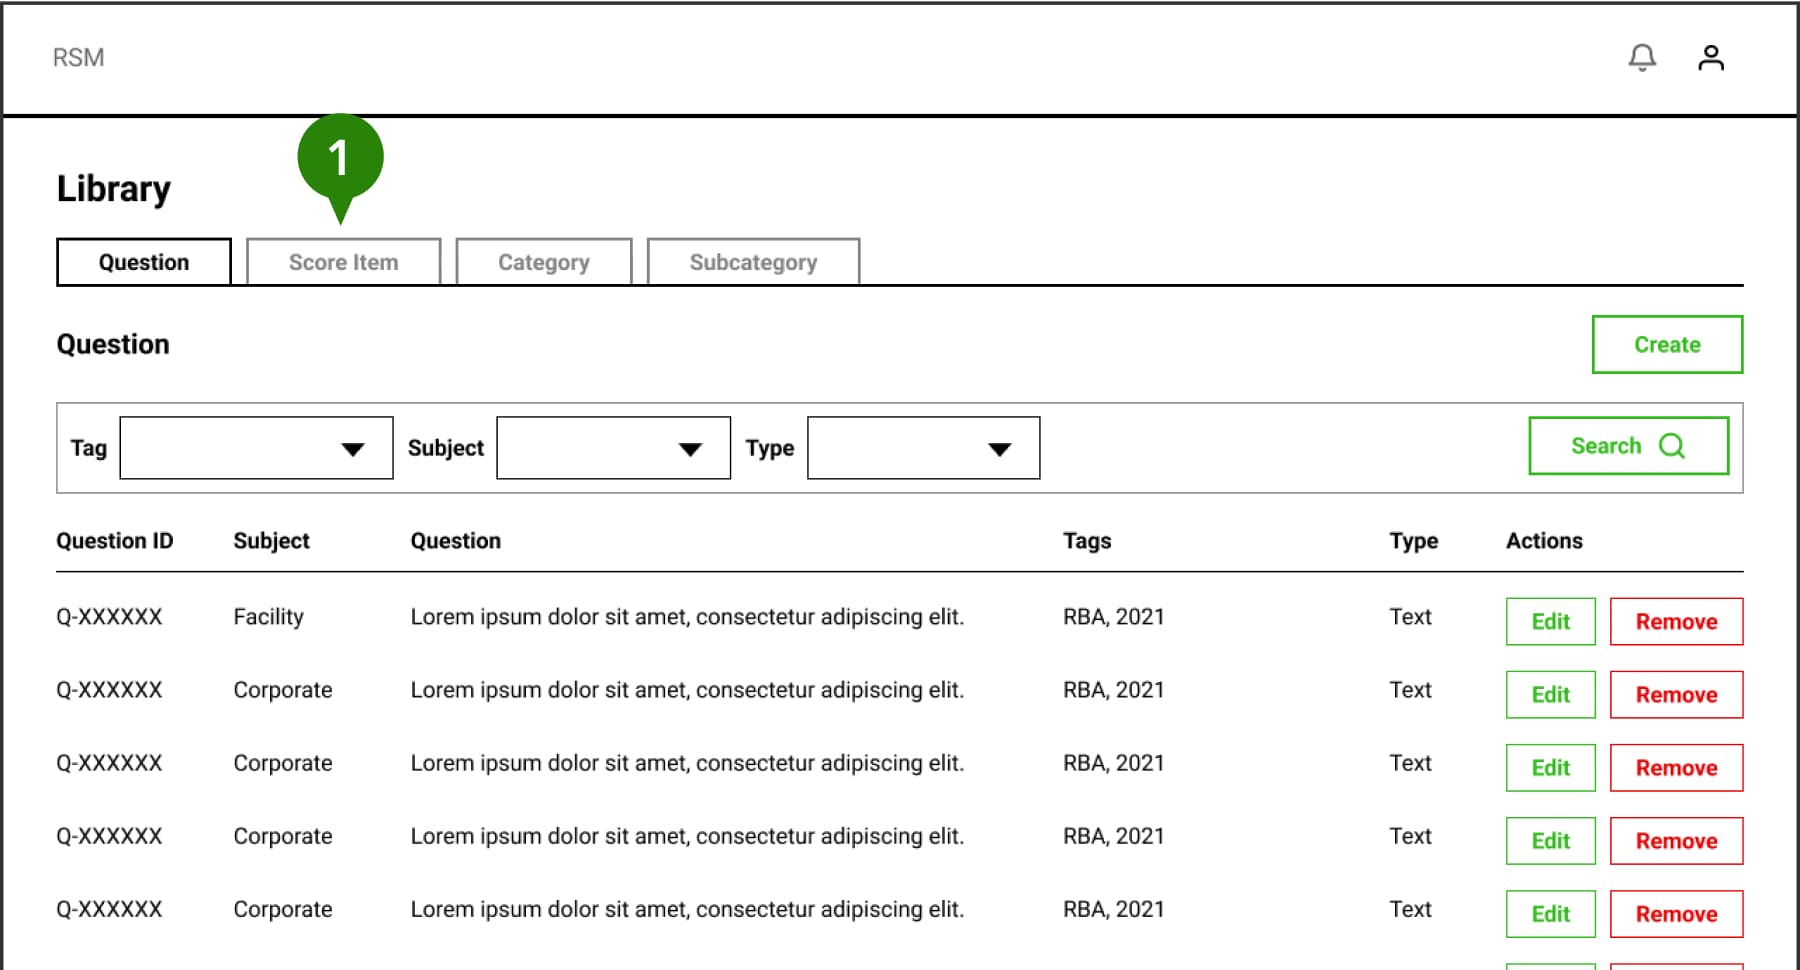
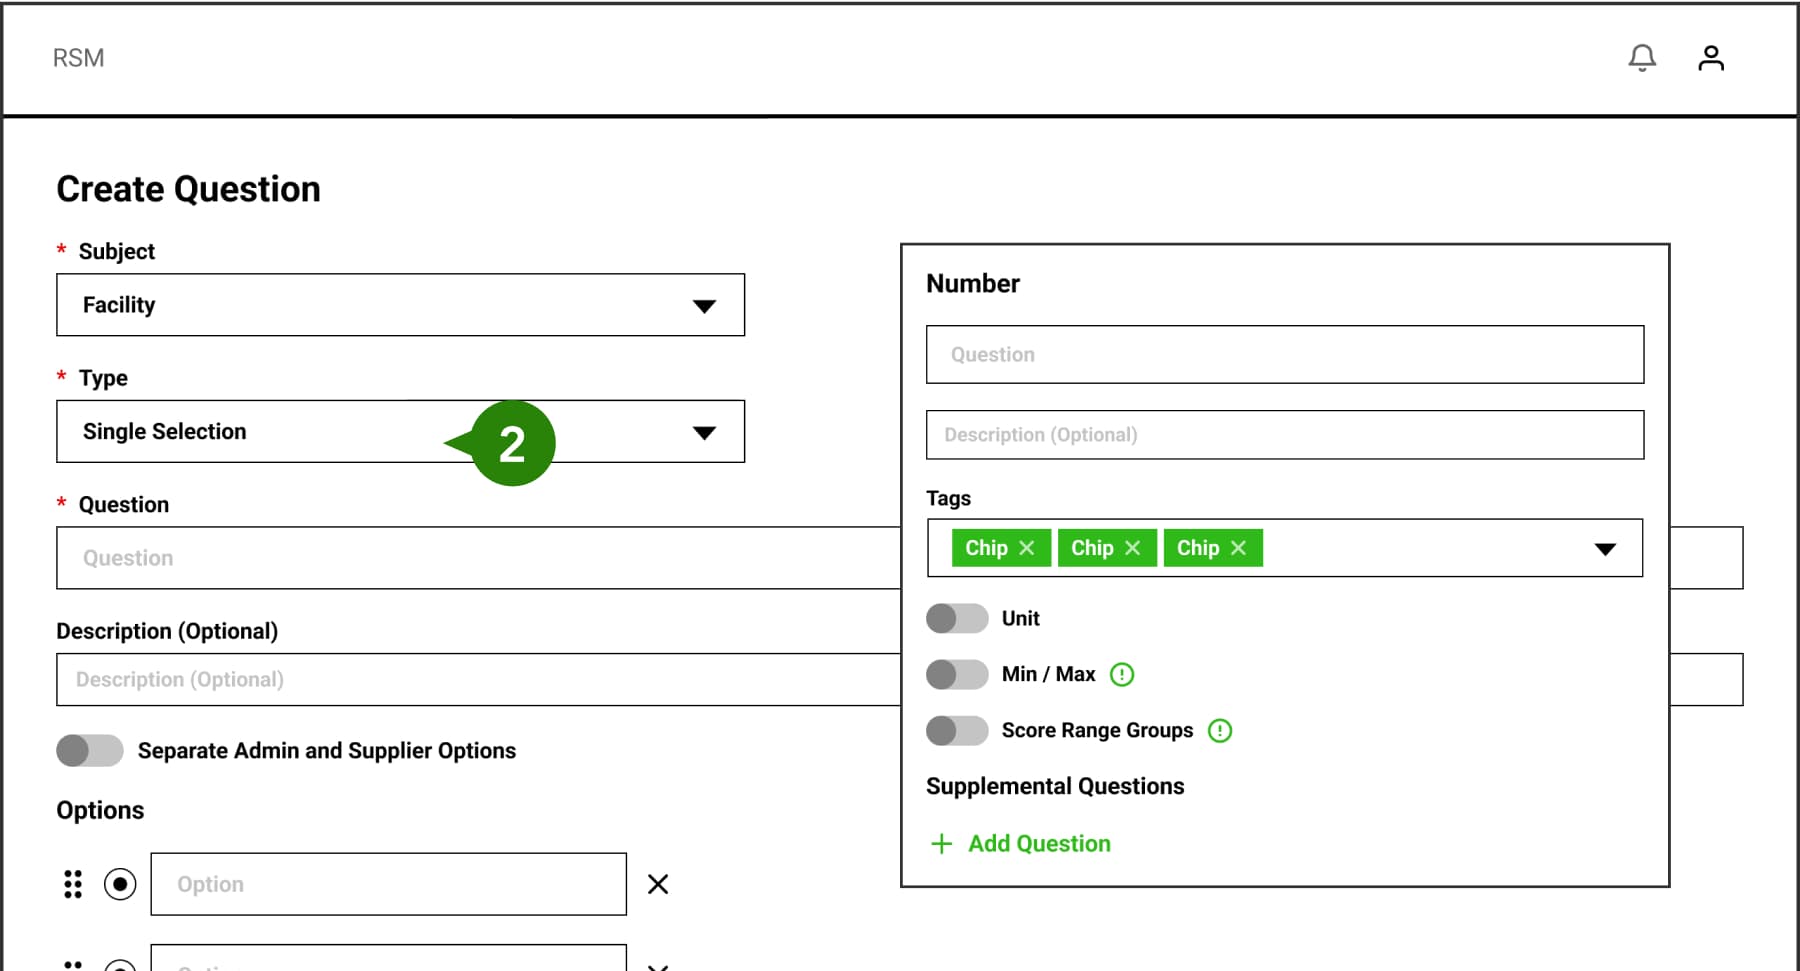
Feature 01 - Library
Supporting Cross-Year Analysis
We created the Library feature to hold a collection of items that would construct the questionnaires and reports, ensuring the same item would be an identical entity across multiple questionnaires that could be used for cross-year analysis.
- The library contains 4 types of items to encompass all the elements needed in a questionnaire and a report.
- Different types of questions will affect the available configurations on the interface.
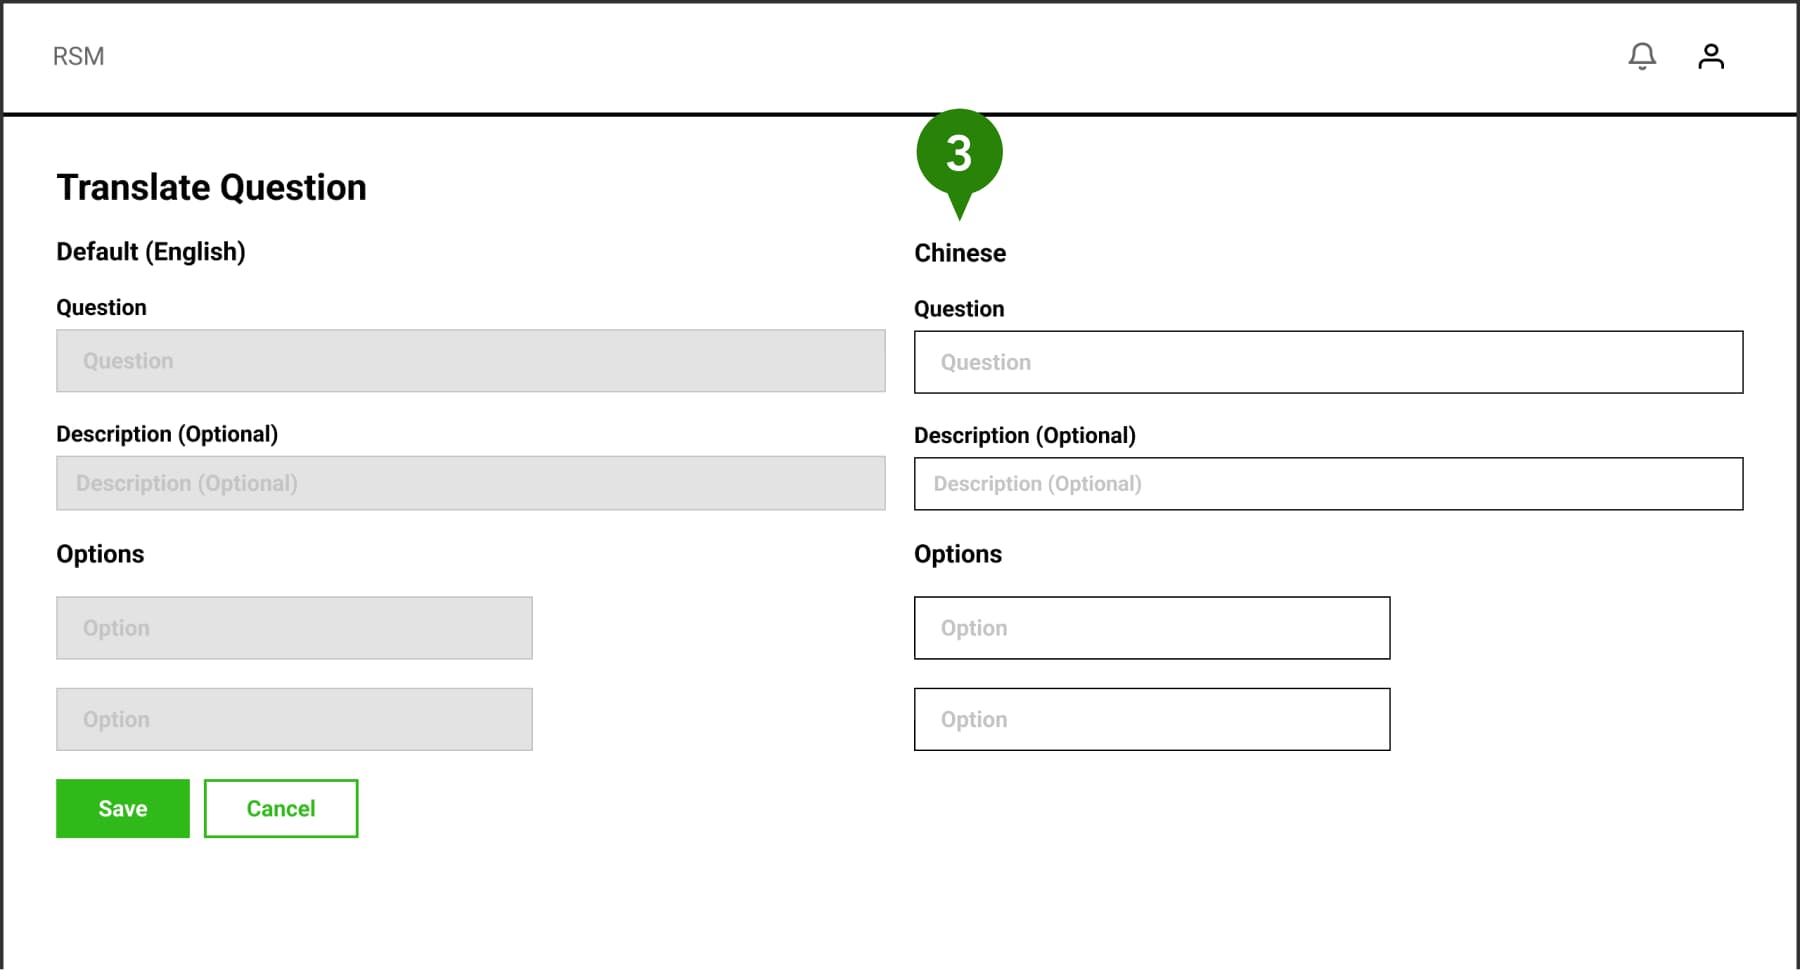
- Admins can also provide Chinese translations for the majority of their suppliers.
Feature 02 - Questionnaires
Tackling Structural Complexity
Questionnaire is a complex design as we crafted it to integrate with the client's existing model. We incorporated user-friendly features to alleviate the difficulty of the setup process and included fool proof designs to enhance user experience.
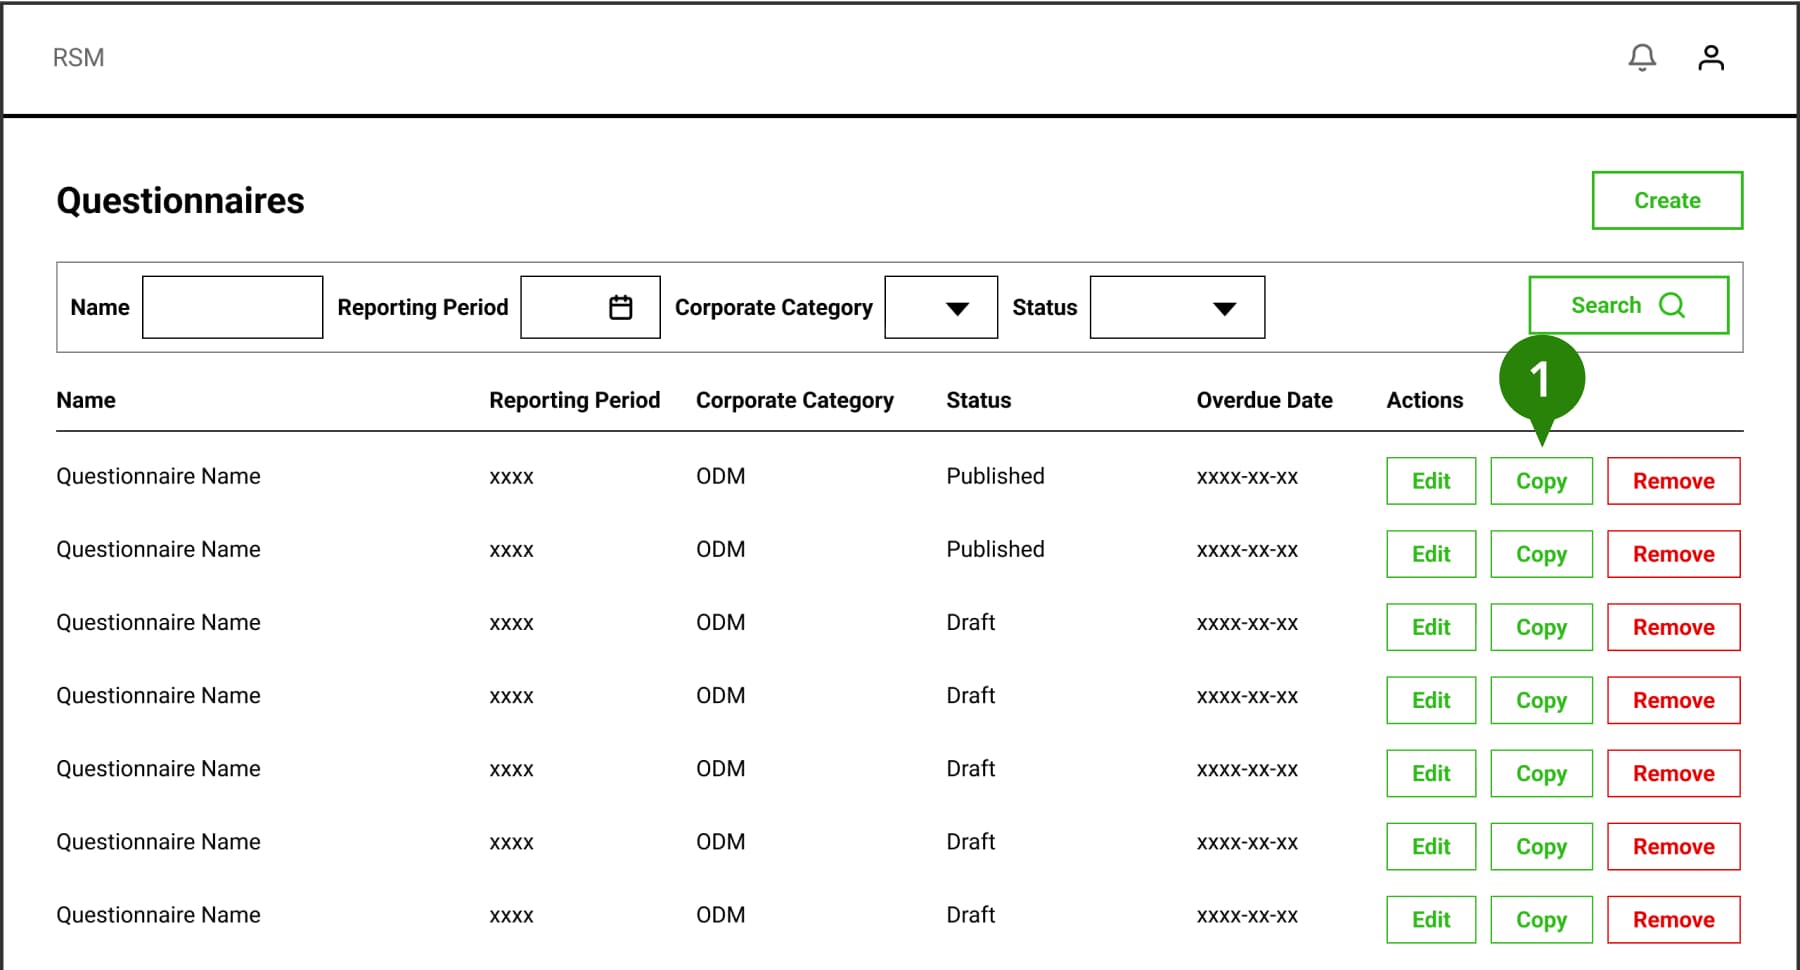
- Admins can copy existing questionnaires to make adjustments from previous ones.
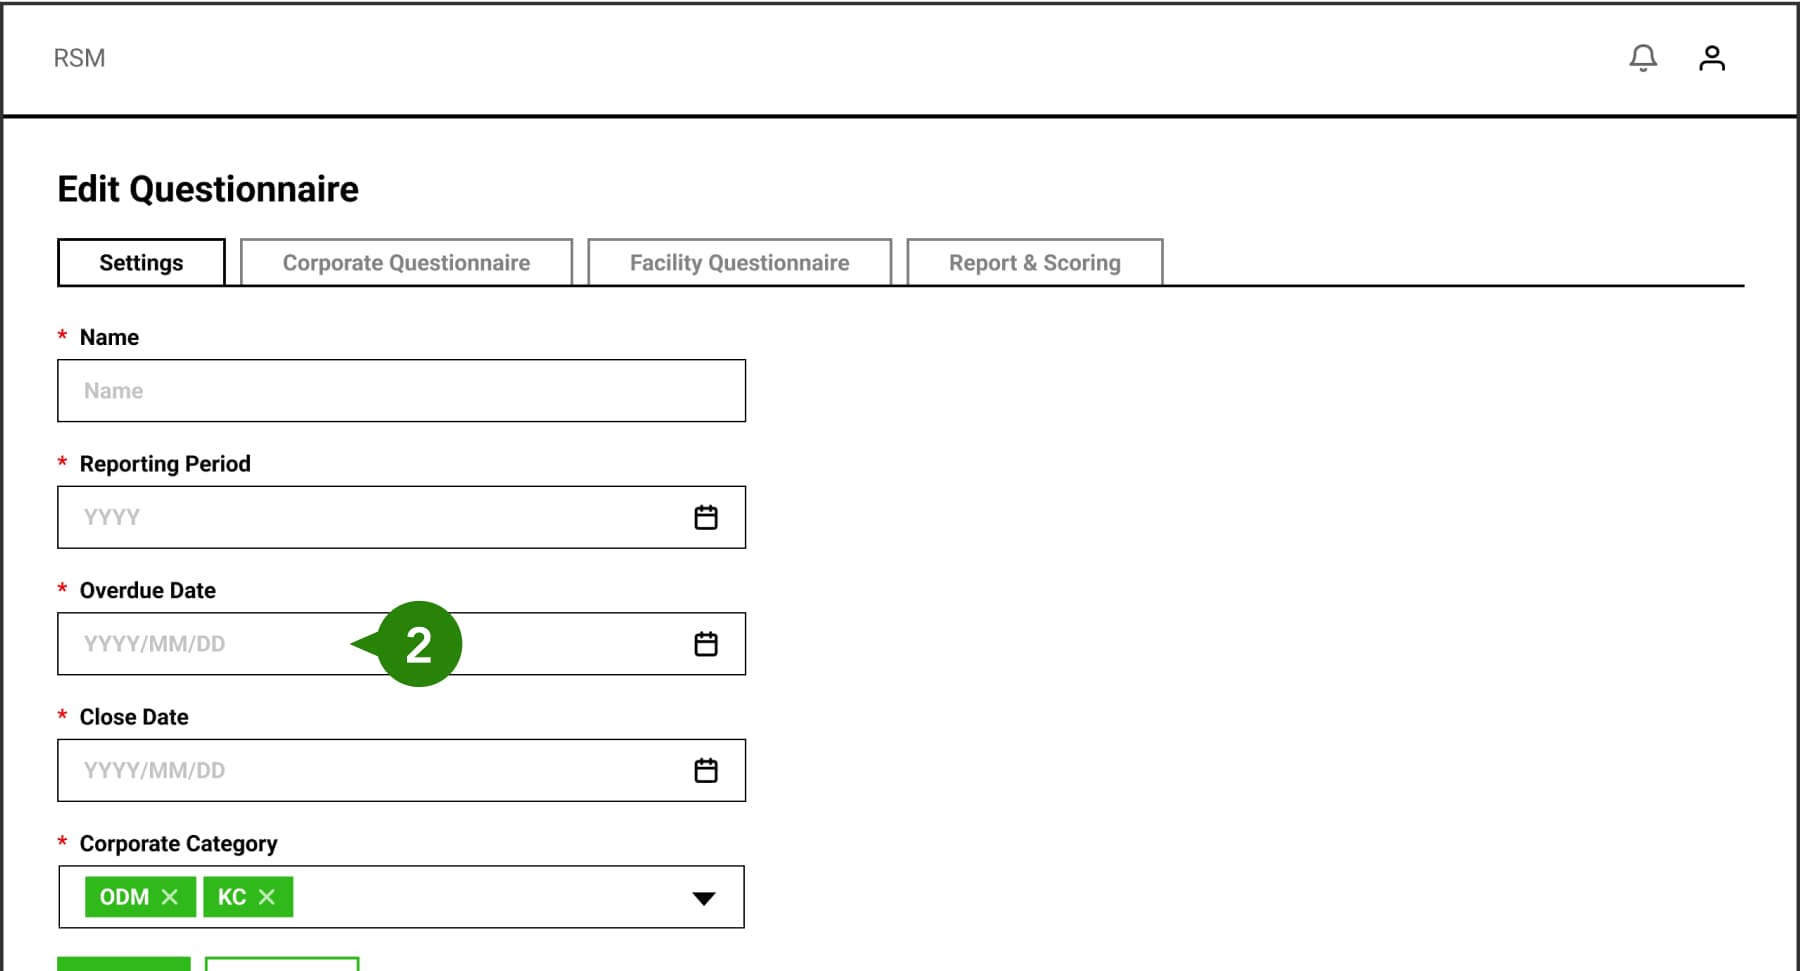
- The system will handle notifying the suppliers when its due and closed for submission.
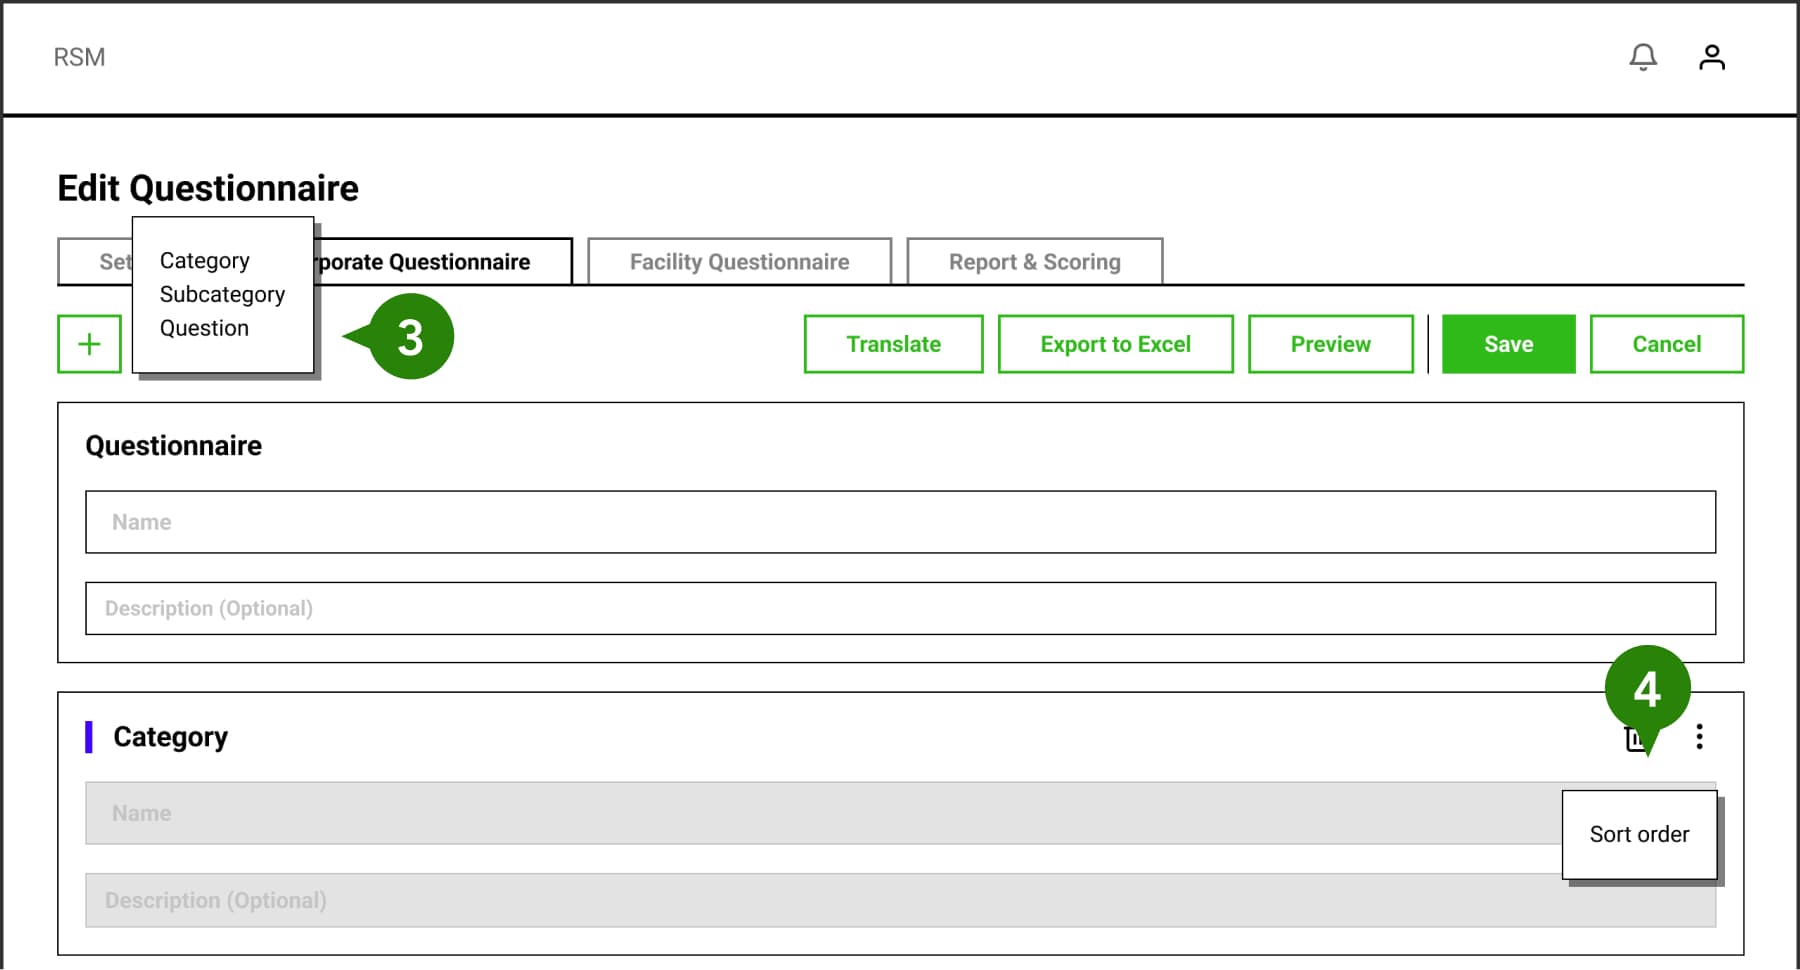
- Items in a questionnaire are imported from the library.
- Questionnaires can grow quite long, so I added an additional popup for sorting the order of items with less visual clutter.
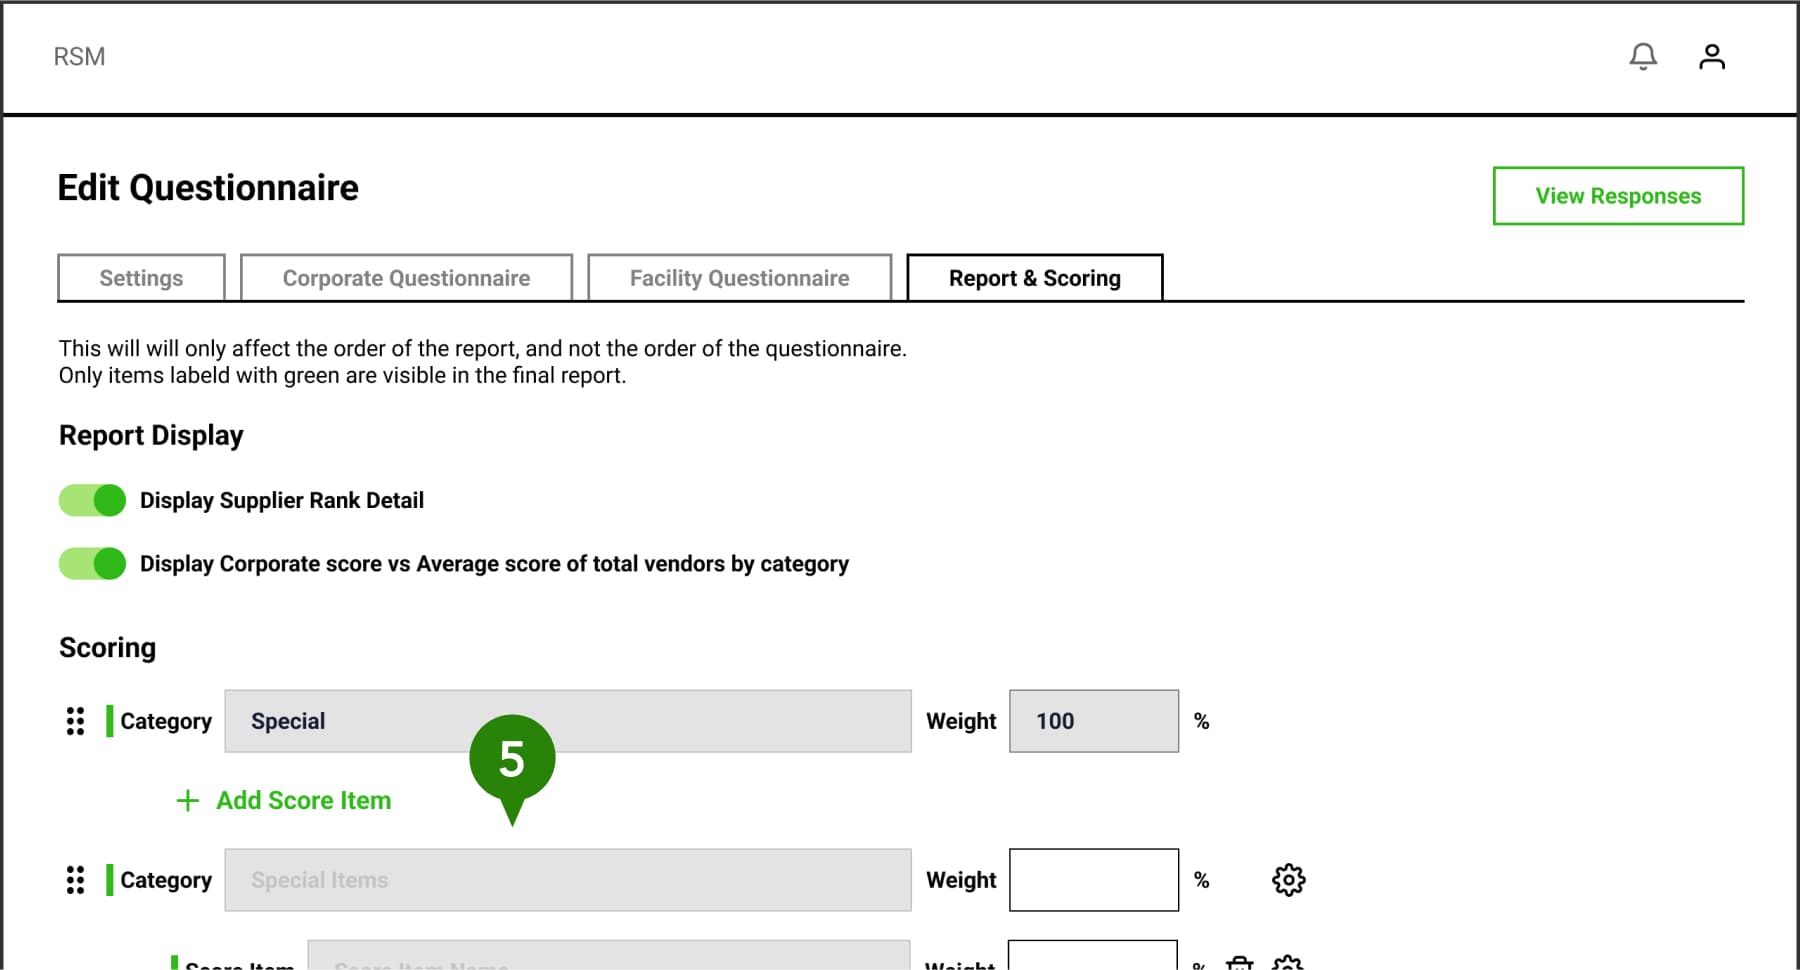
- Admins can only use items from the questionnaire structure to configure the scores settings to ensure all the content is valid.
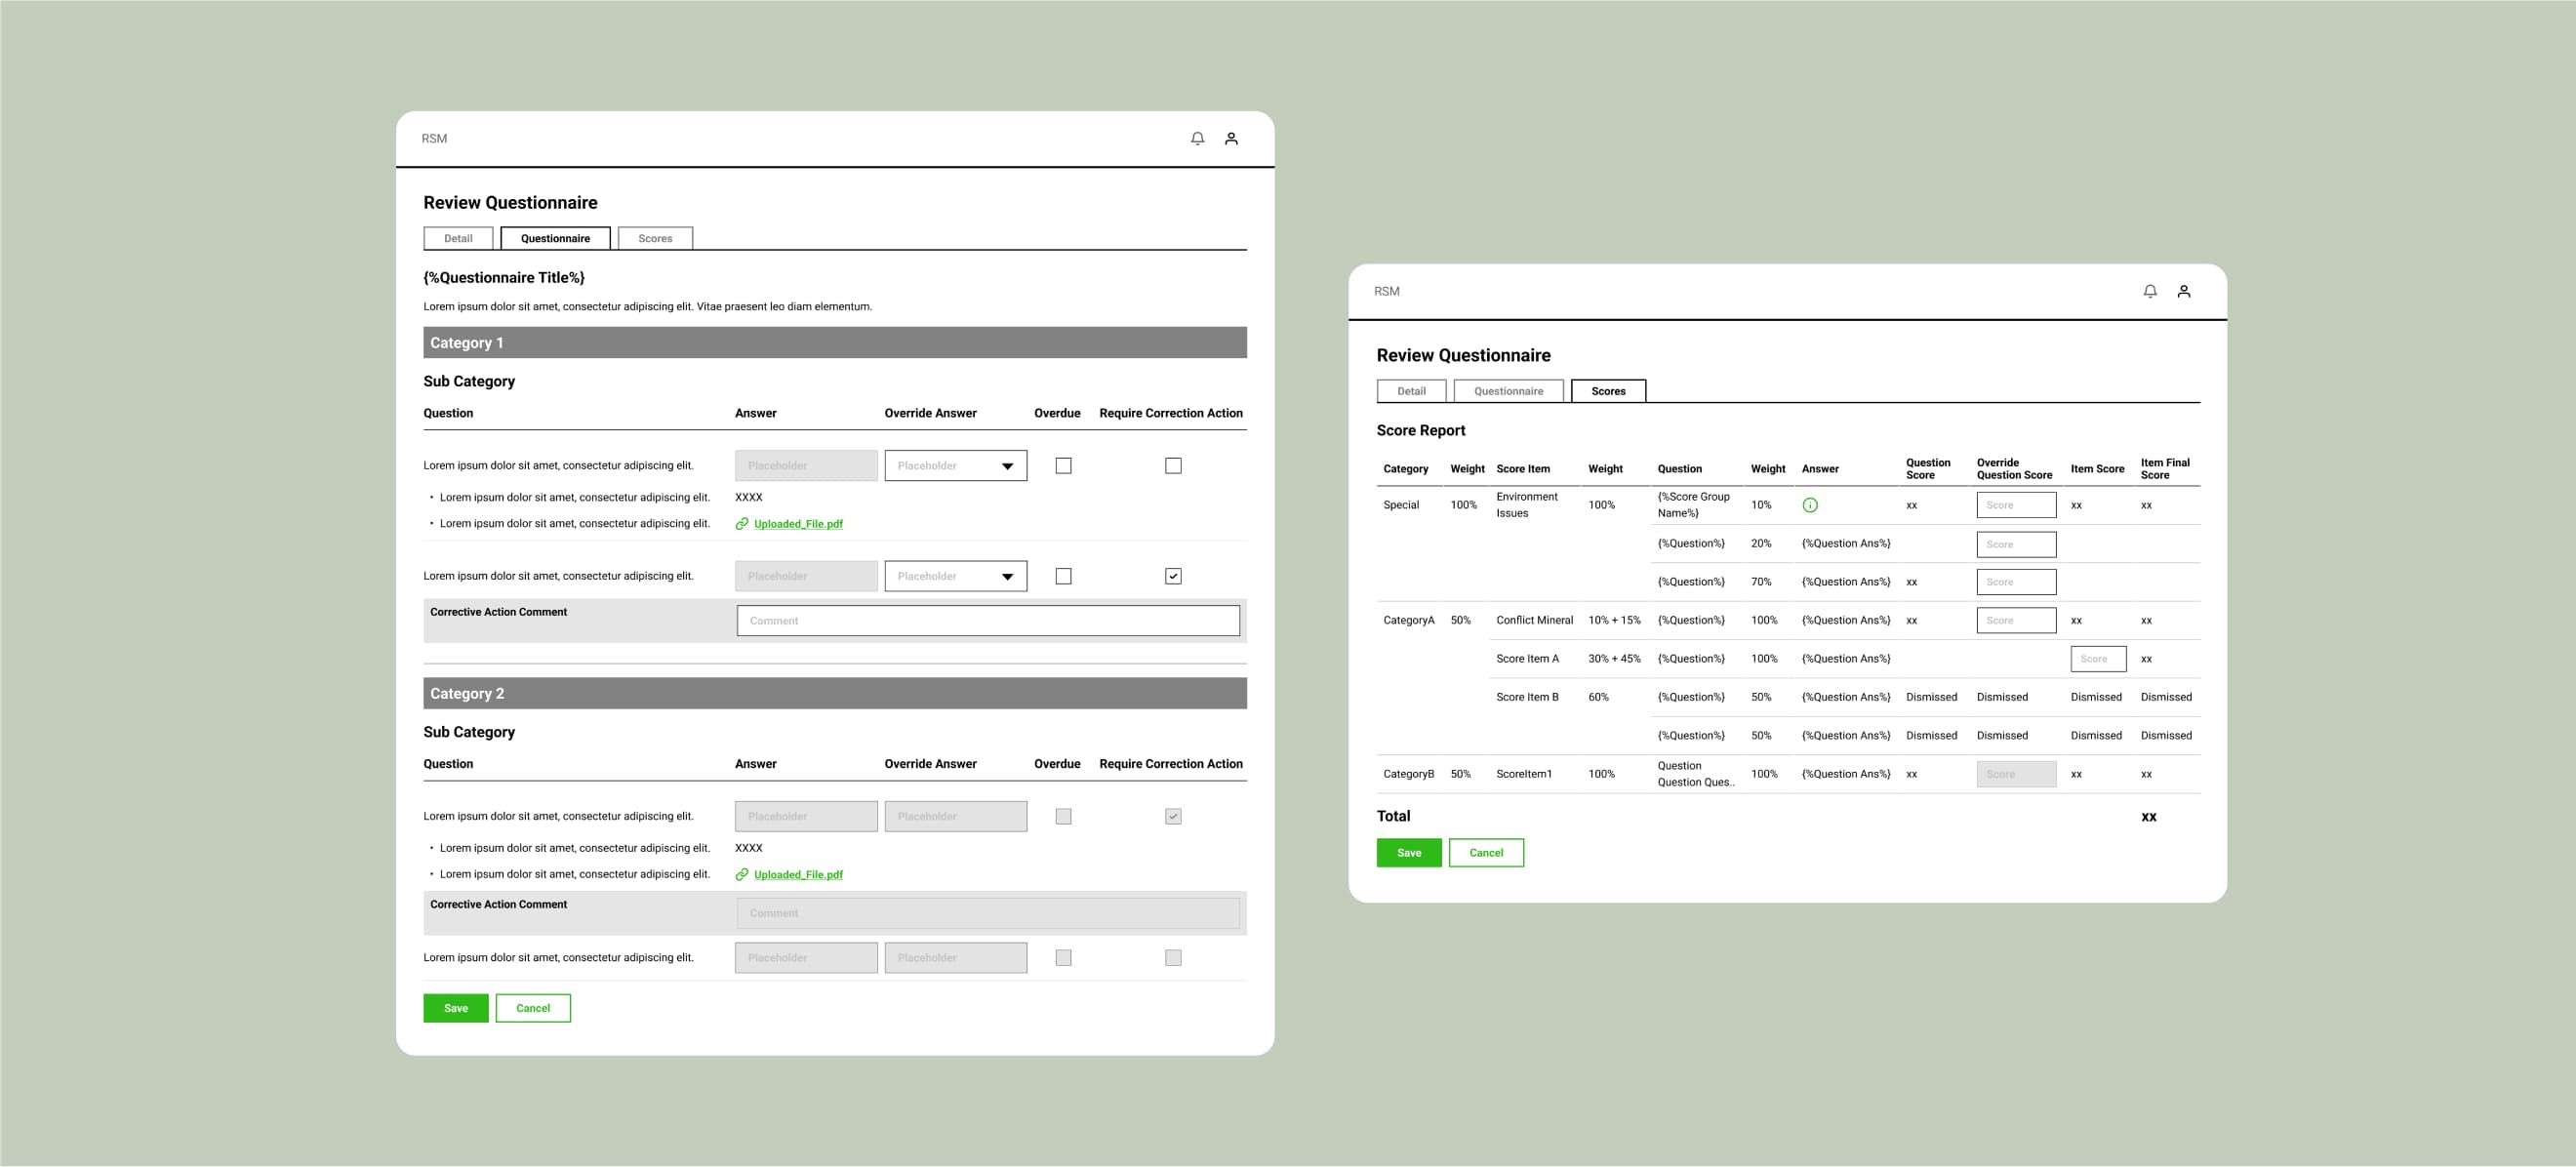
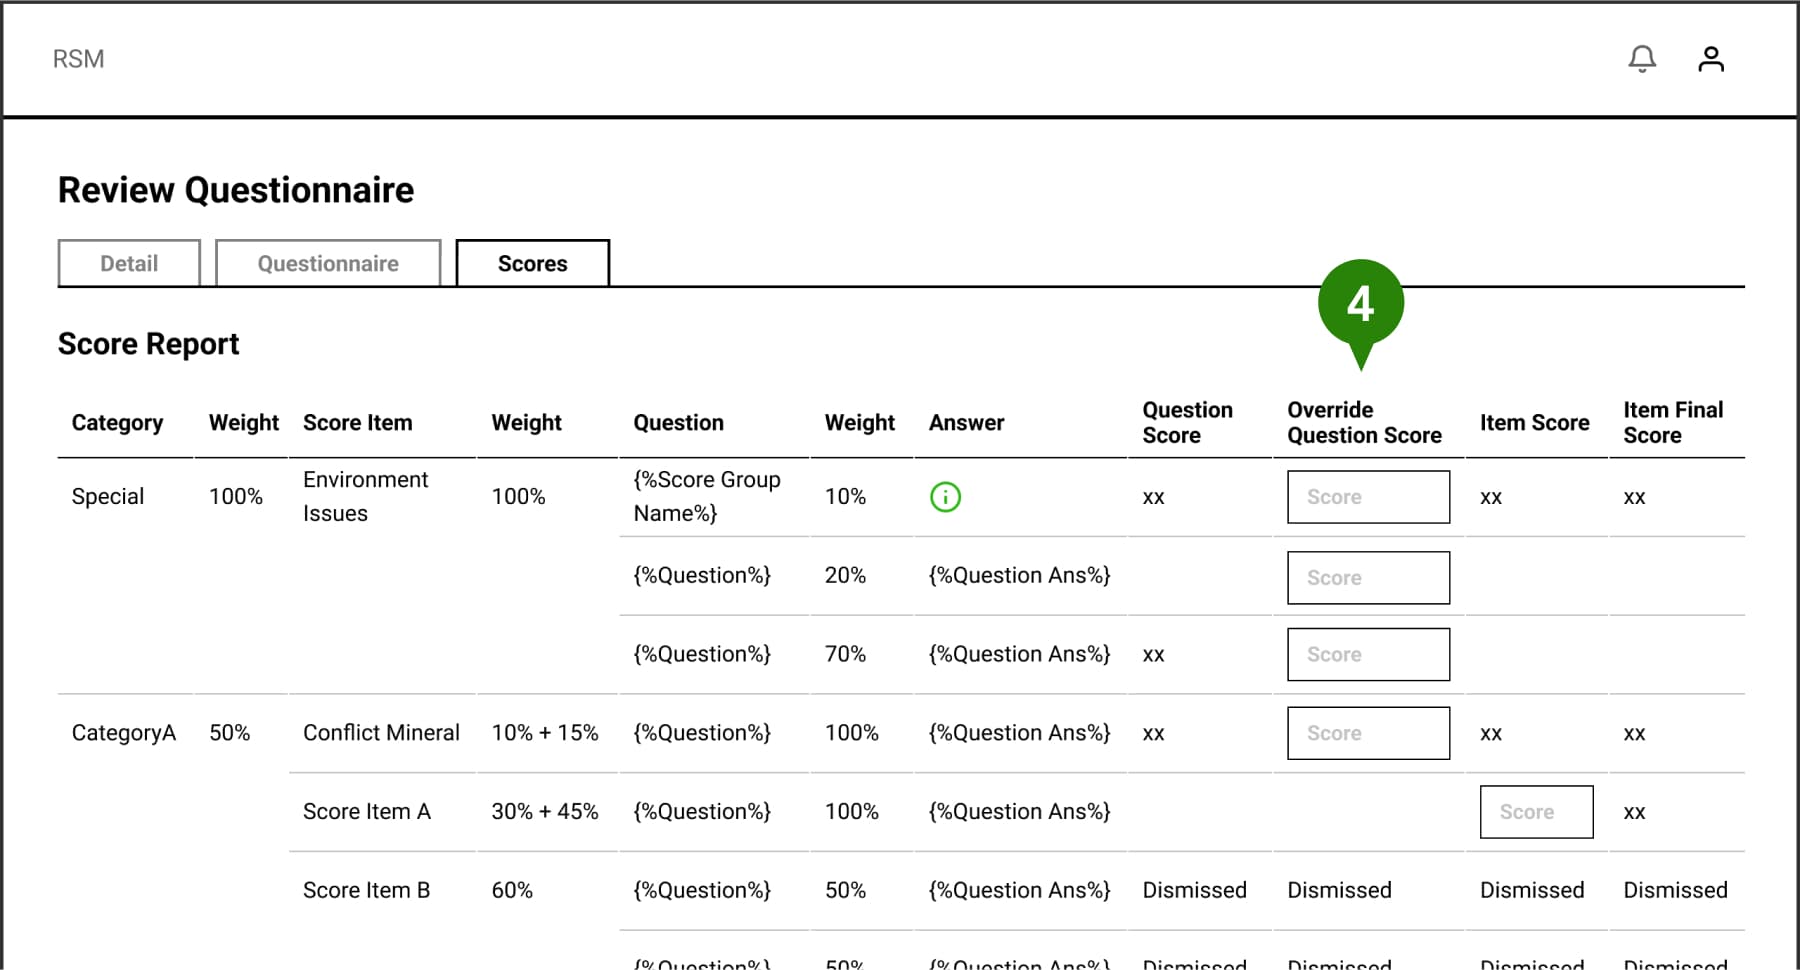
Feature 03 - Responses
Enabling Audit Flexibility
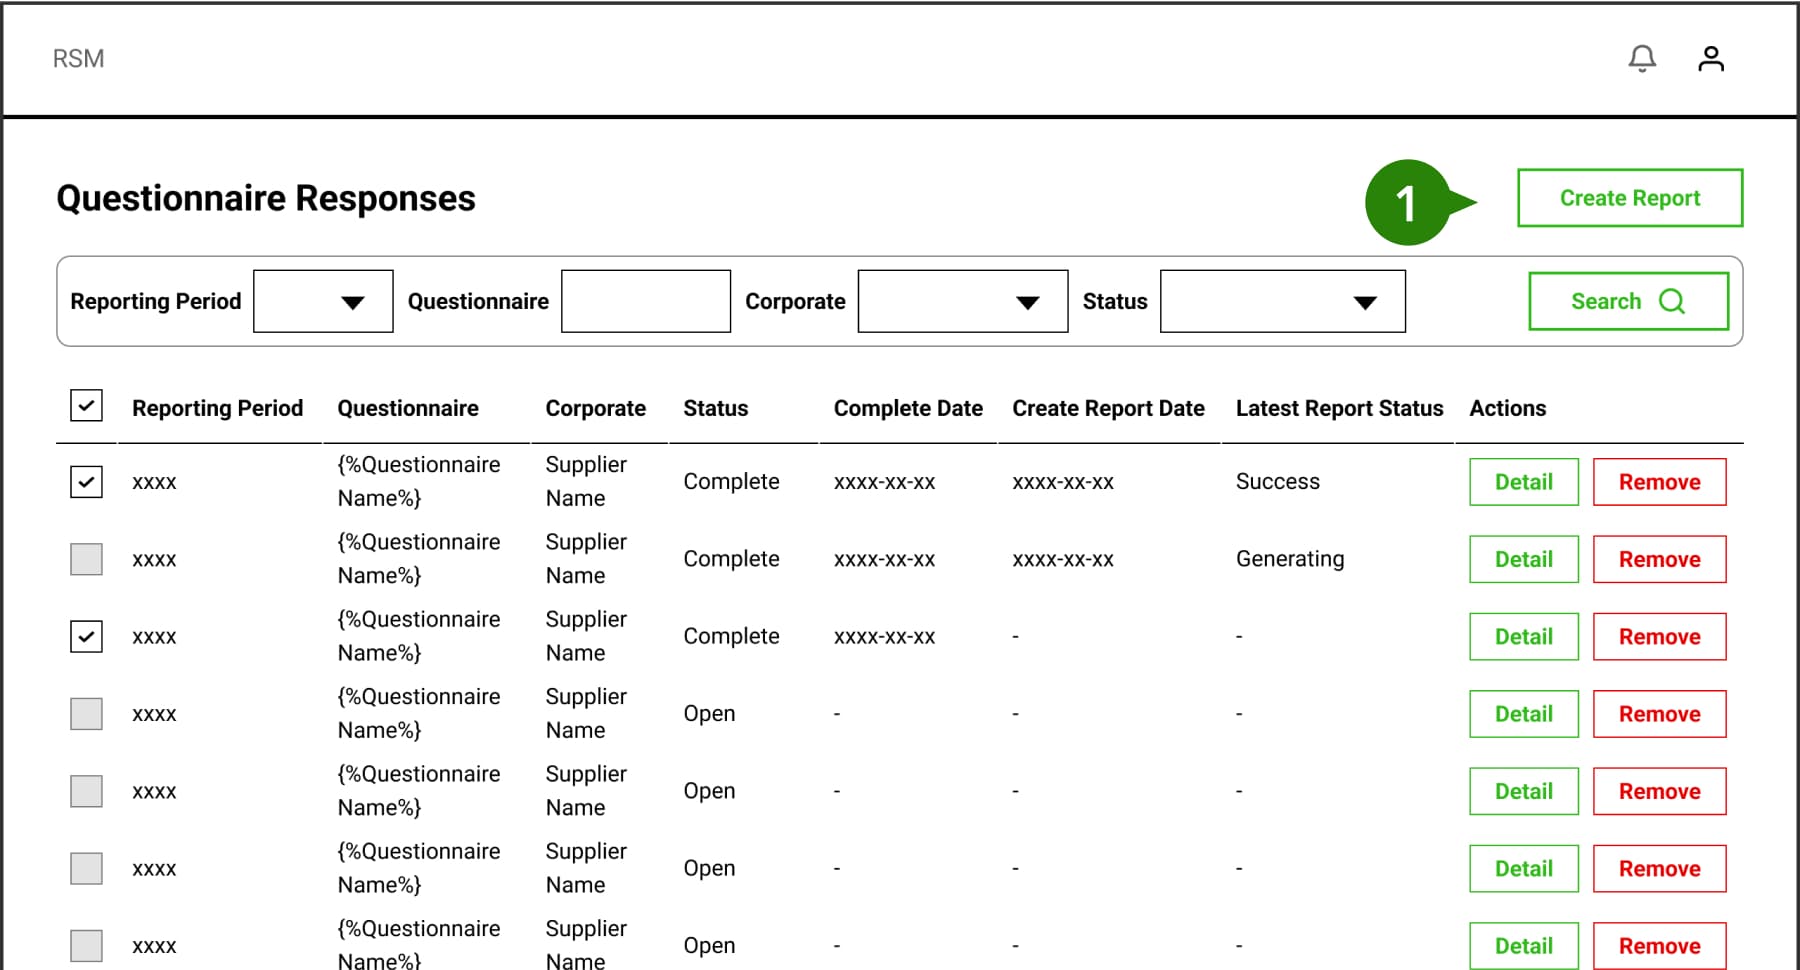
Under Responses, the admins would audit the responses from the suppliers, and generate them into reports once audit is complete. We made sure to leave room for custom changes, as the auditing process was mostly manual and not automated.
- Once all the responses from a supplier has been audited, the admin may start creating the report with the final scores and rankings.
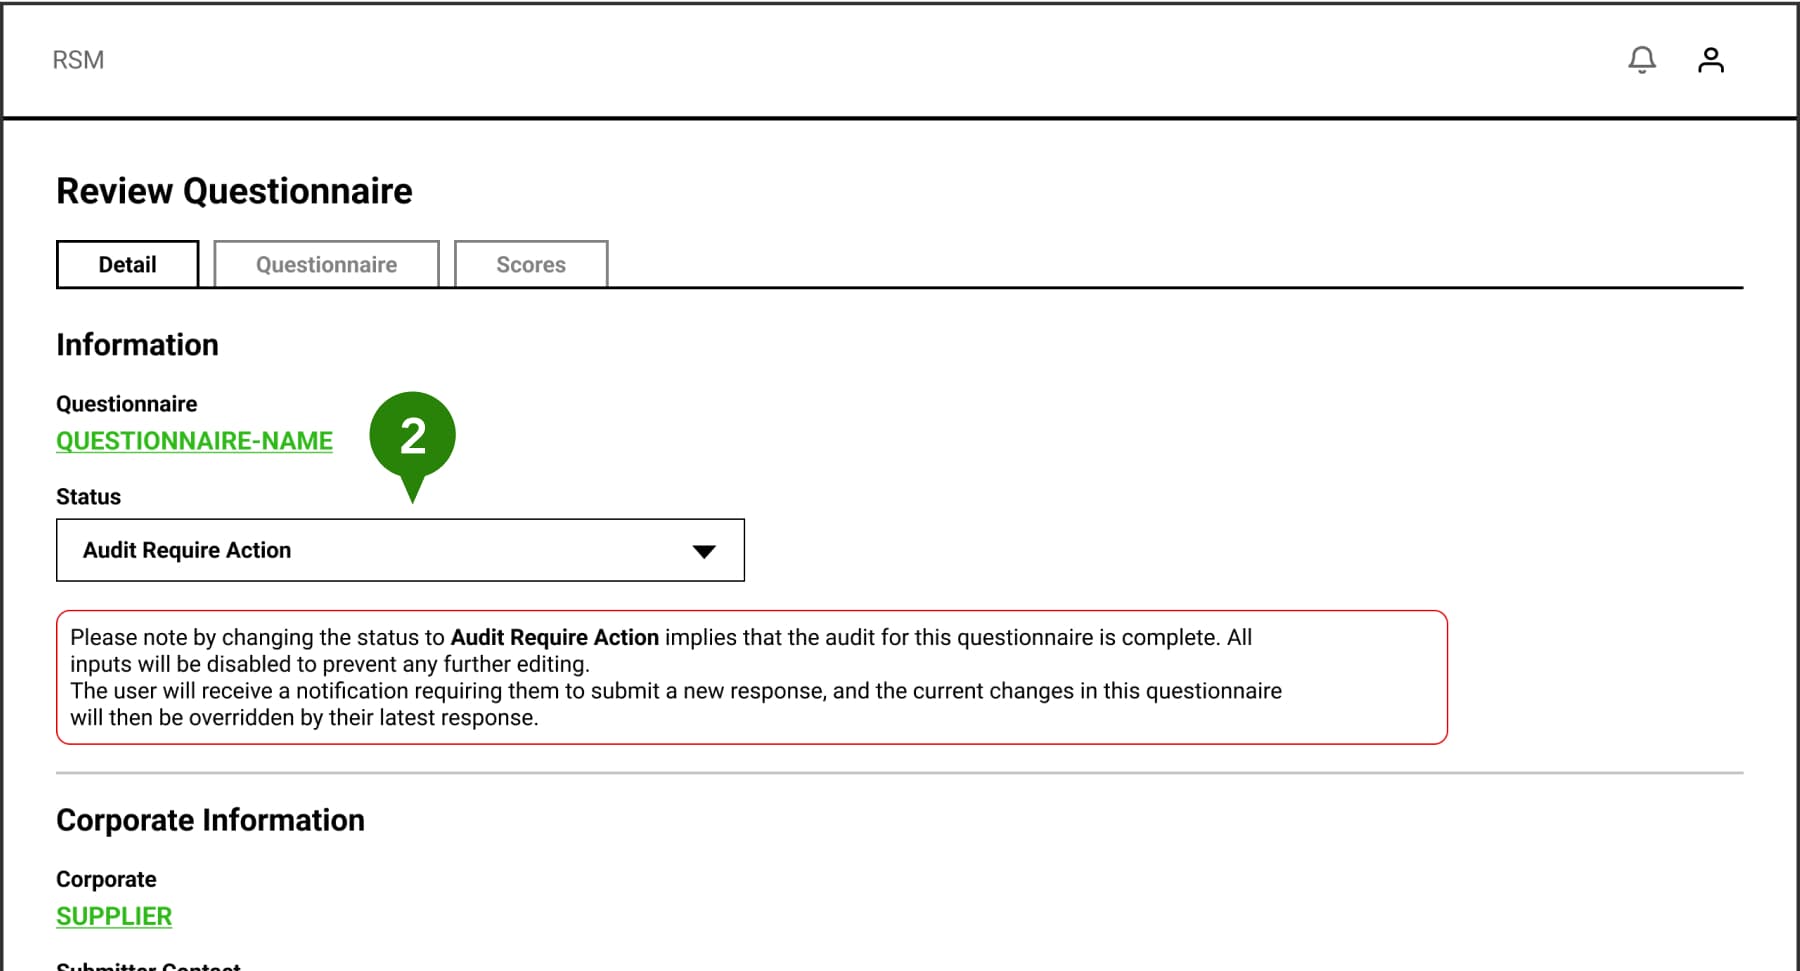
- Admins can change the status of the response based on the audit result.
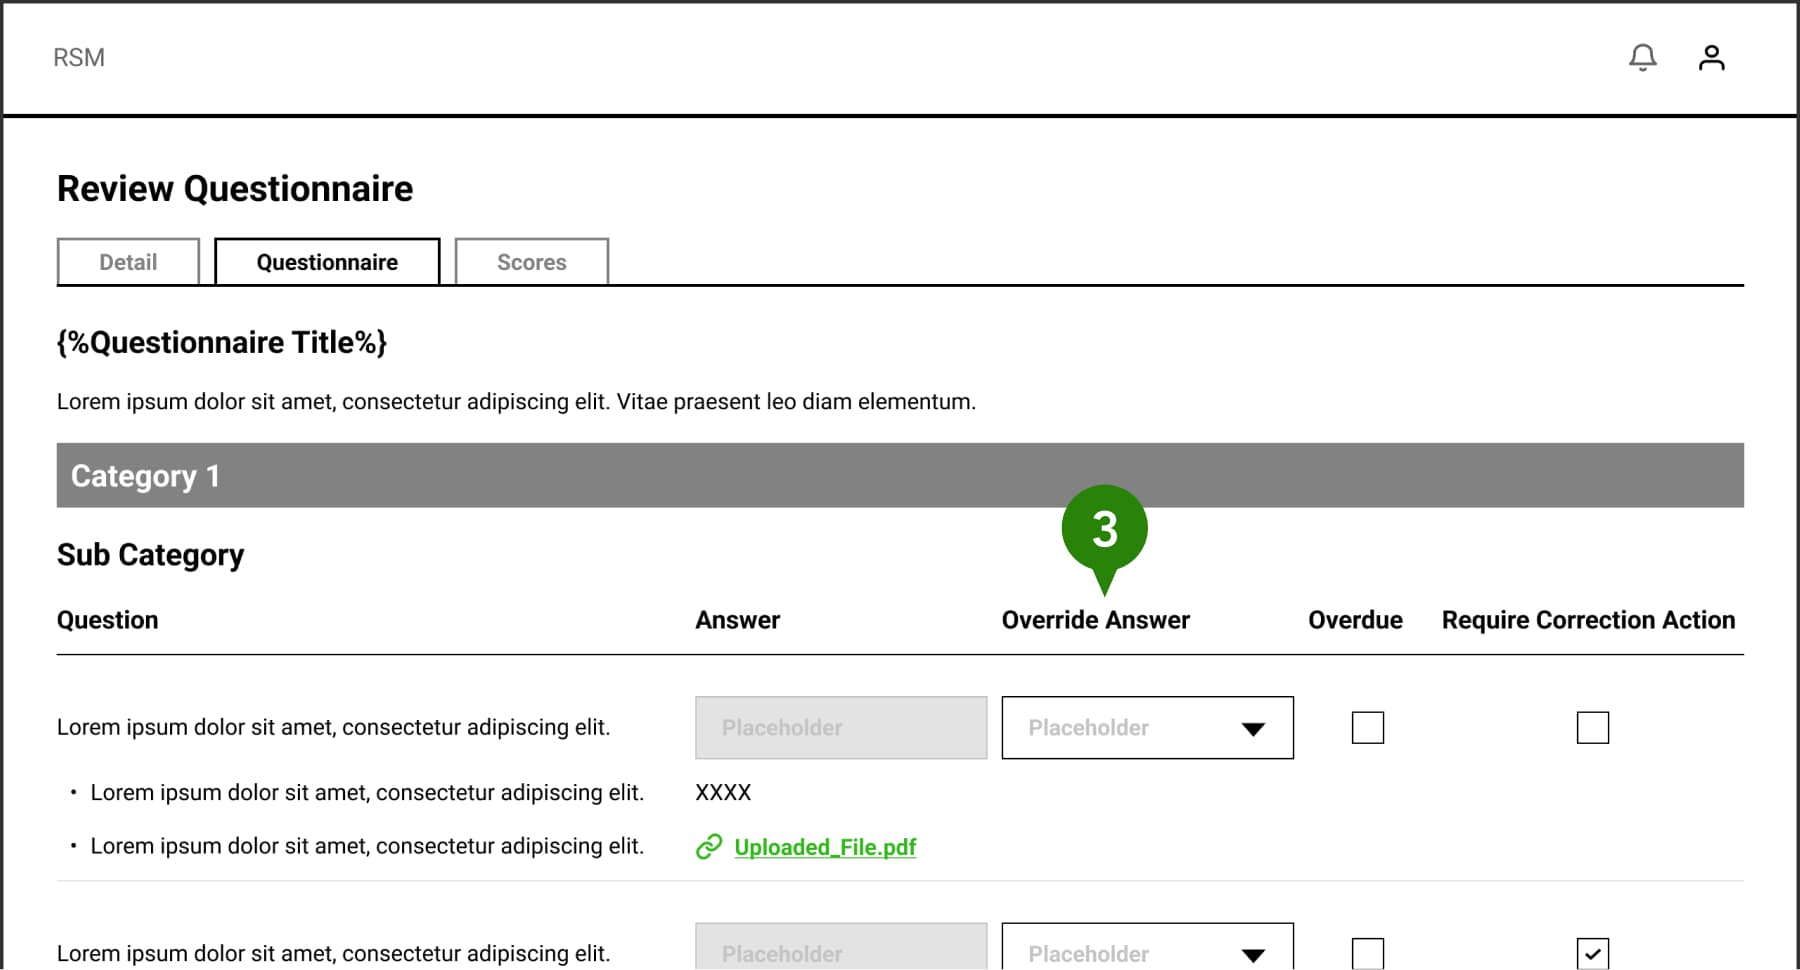
- While the system would handle fundamental operations, admins retain the ability to override its actions.
- As corporates and facilities receive different sets of questions but are scored collectively, the scoring page will restrict admins from altering scores that don’t pertain to the target of the question.
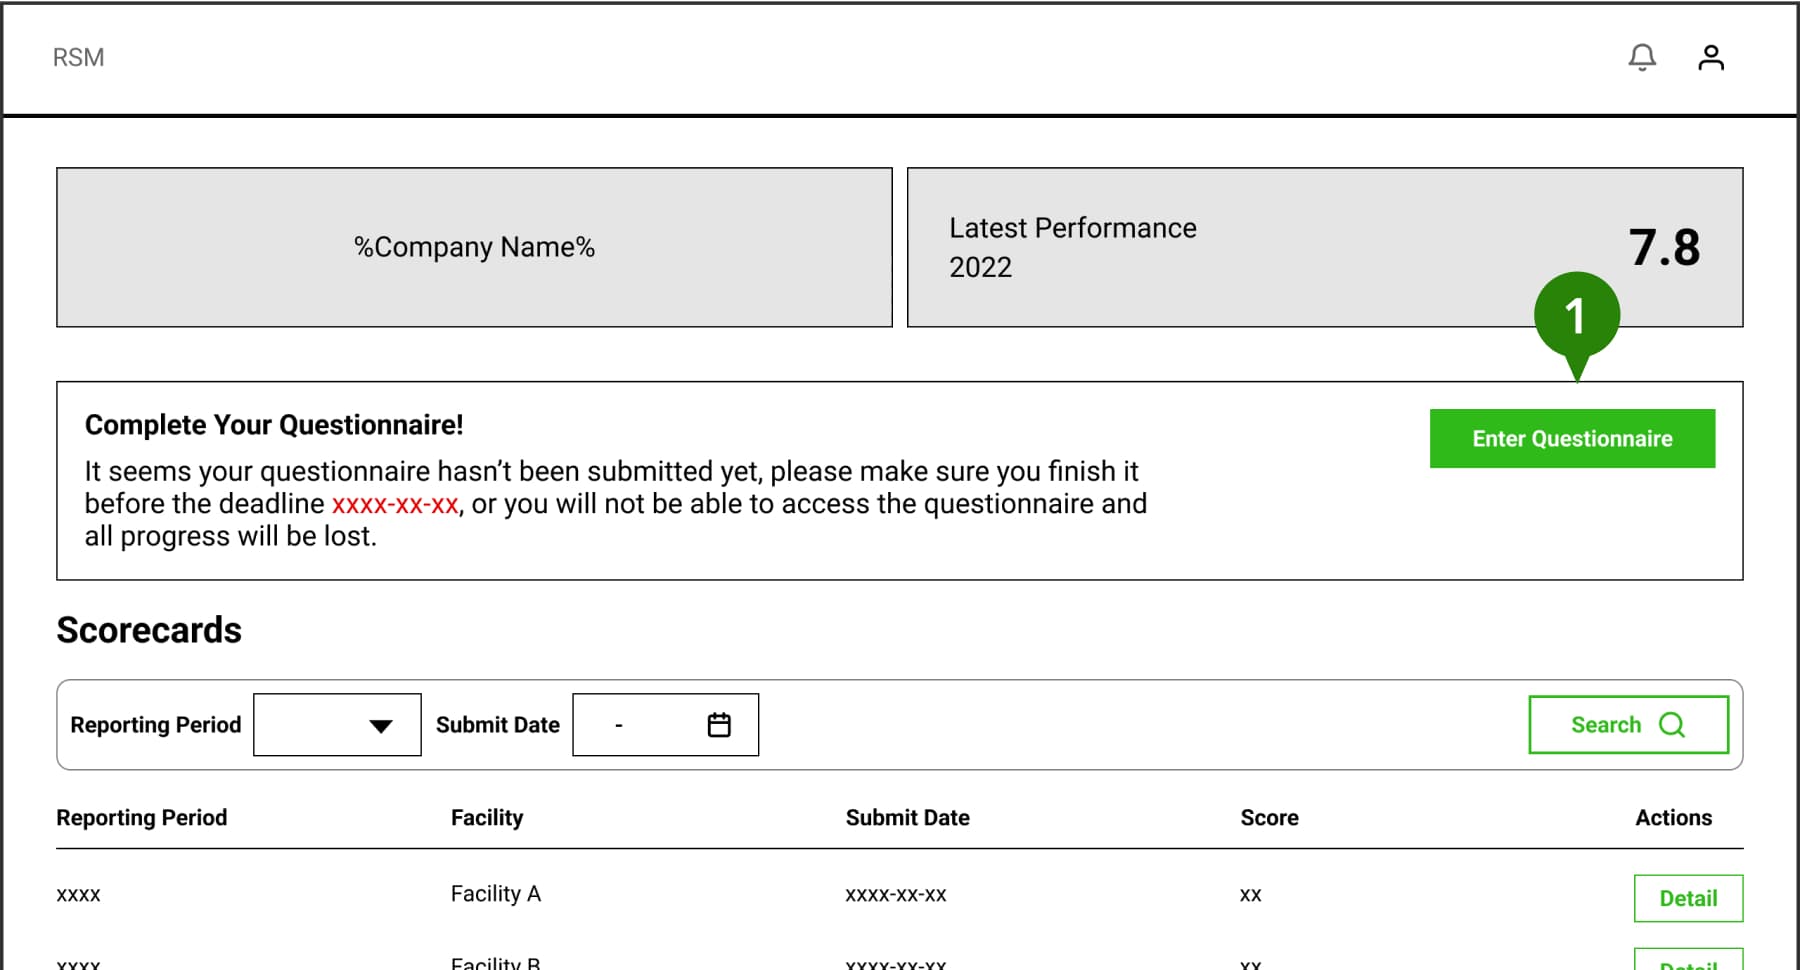
Feature 04 - Supplier's View
Crafting An Intuitive Flow
Corporates and facilities can access their previous scores and reports from the front stage of the website. As submitting questionnaires was done only anually, our aim was to ensure an intuitive and seamless experience for this process.
- The system will notify and prompt the users to finish the latest questionnaire. This was placed at the top of the page since it’s the most important and newest piece of information.
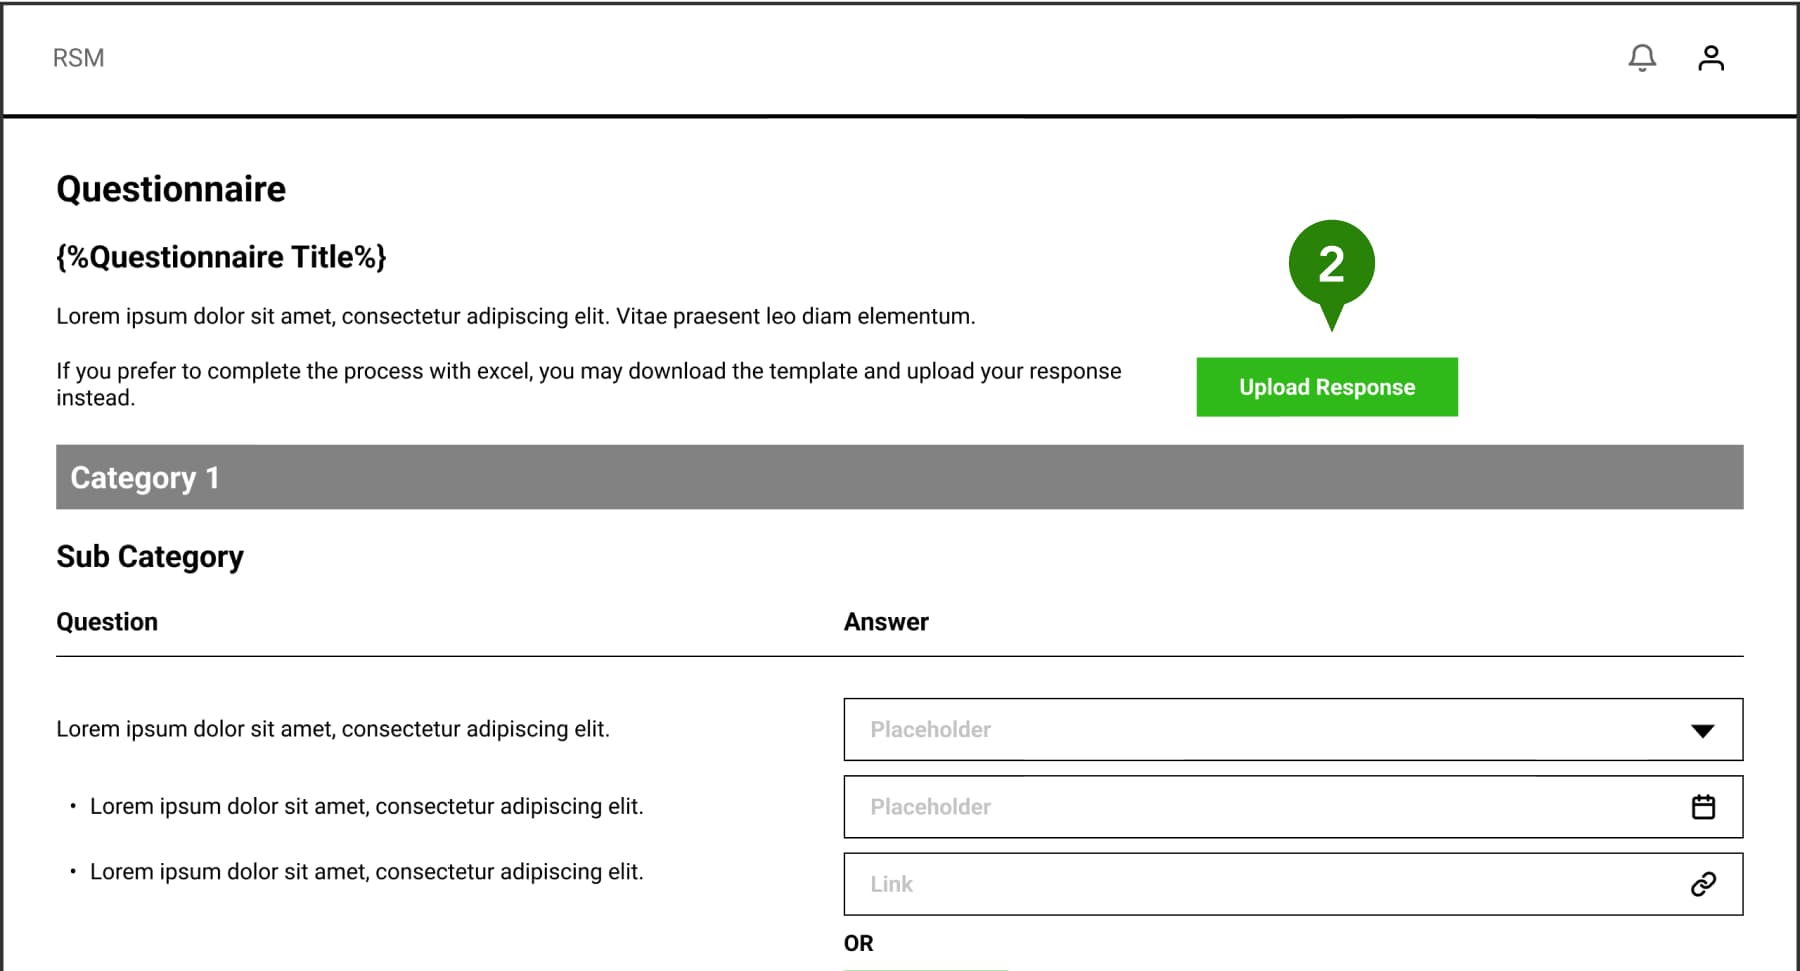
- We wanted to allow users to transition from using Excel sheets to the new system, so we incorporated a feature where they could download the questionnaire as an Excel, and upload their answers in the file.
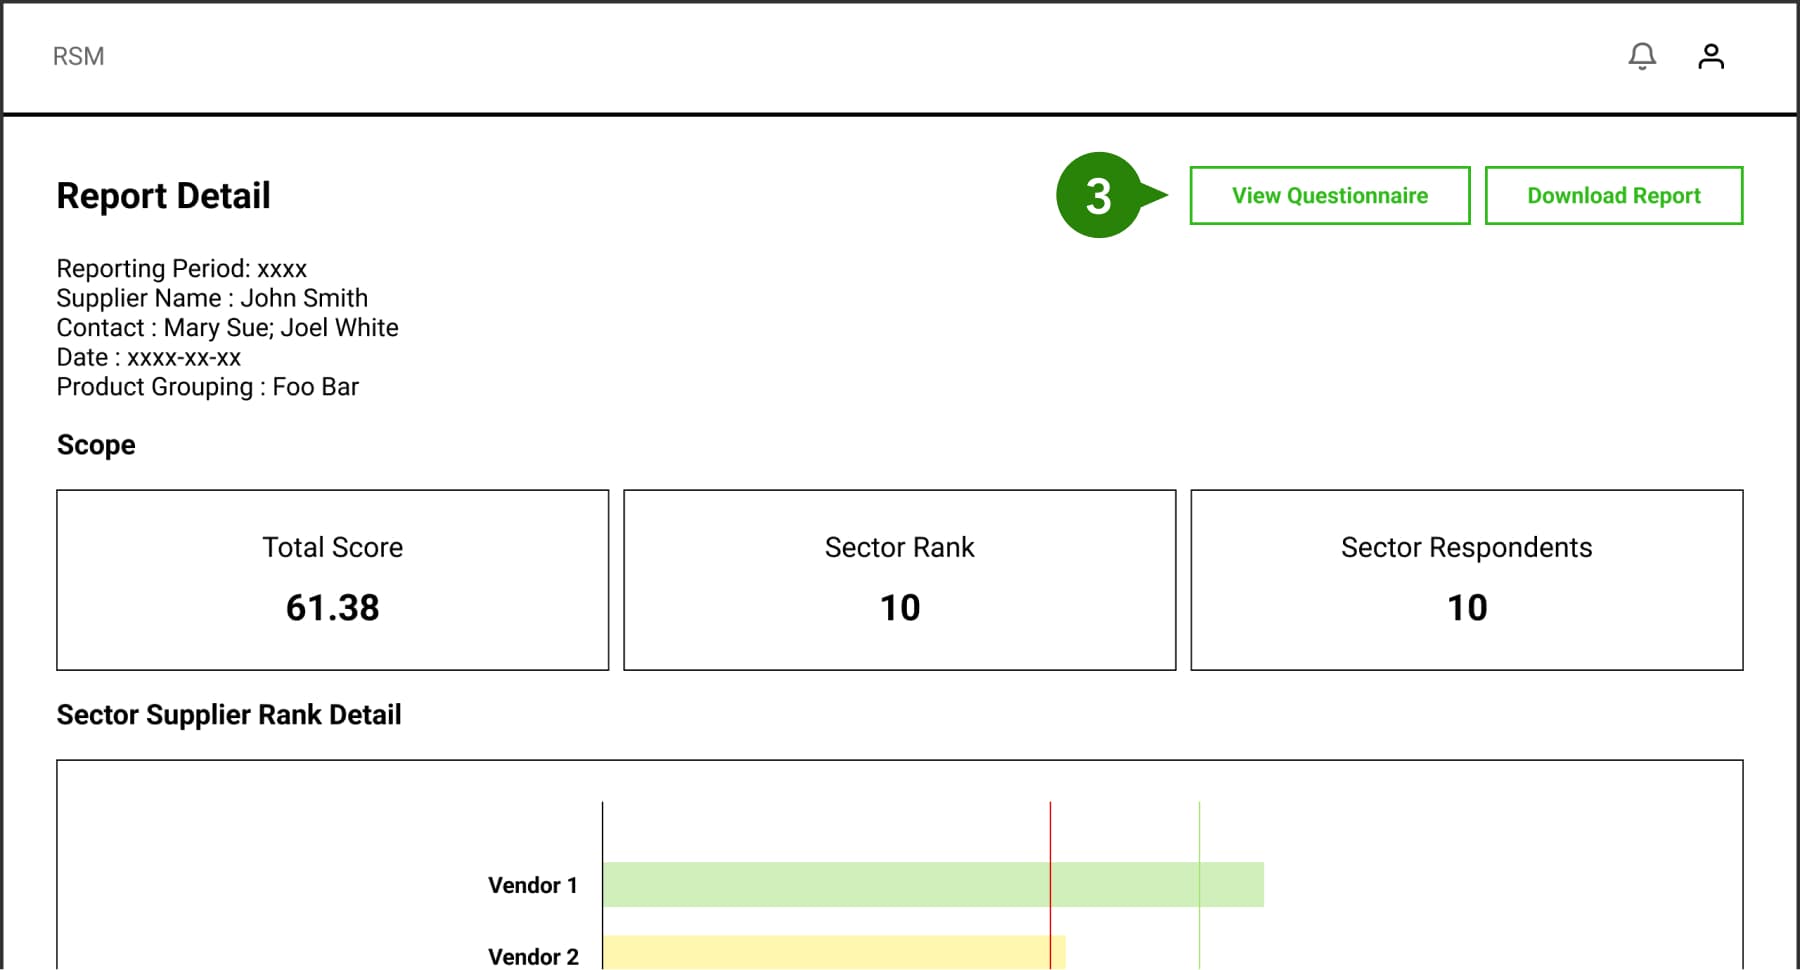
- Users could access the questionnaire that led to the scores of the reports to see their previous answers.
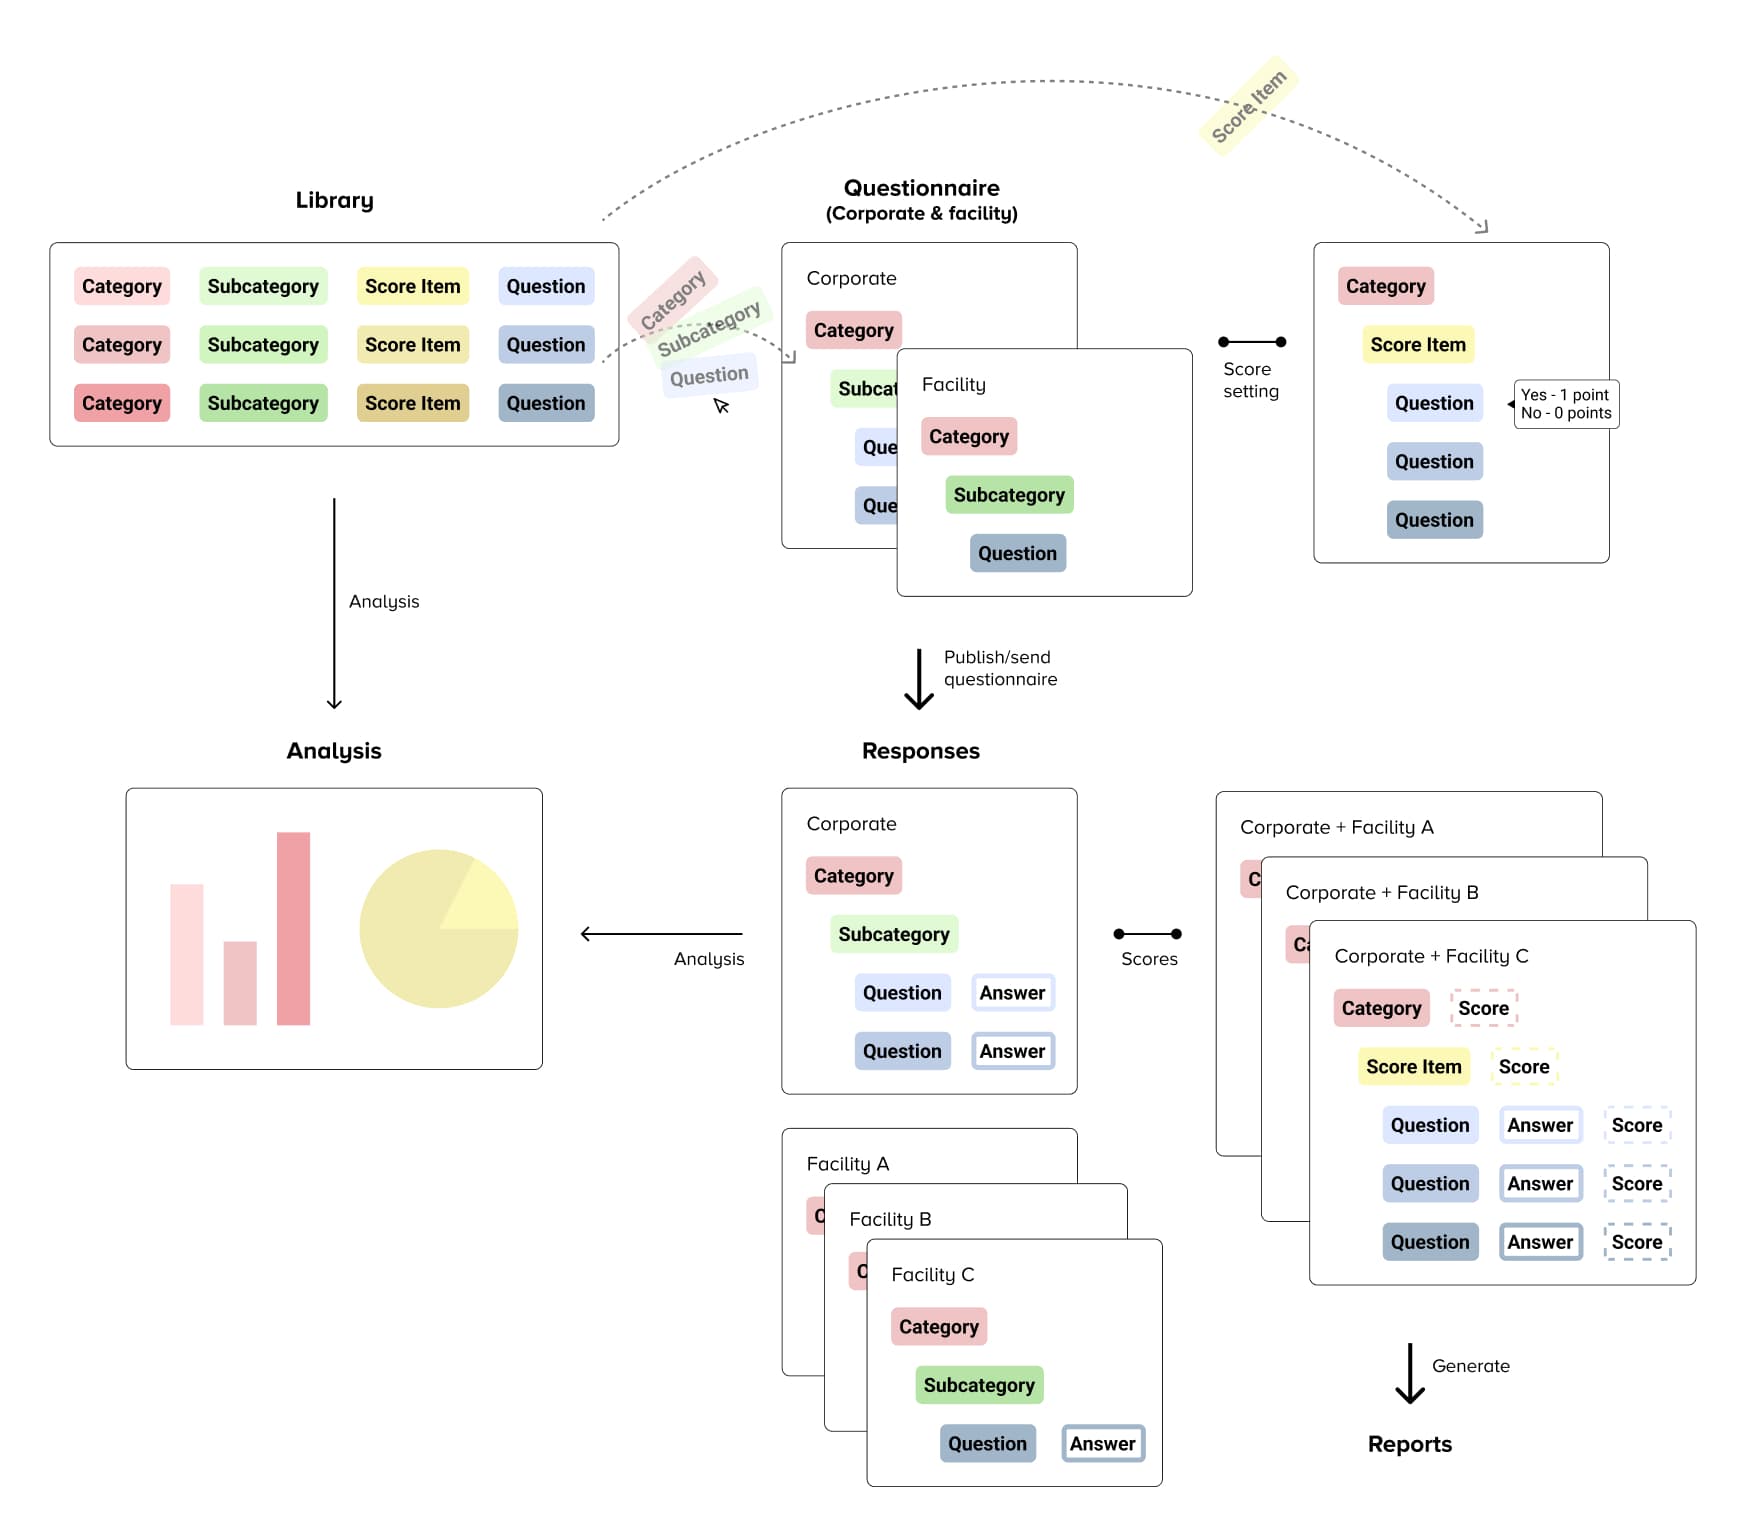
Database Design
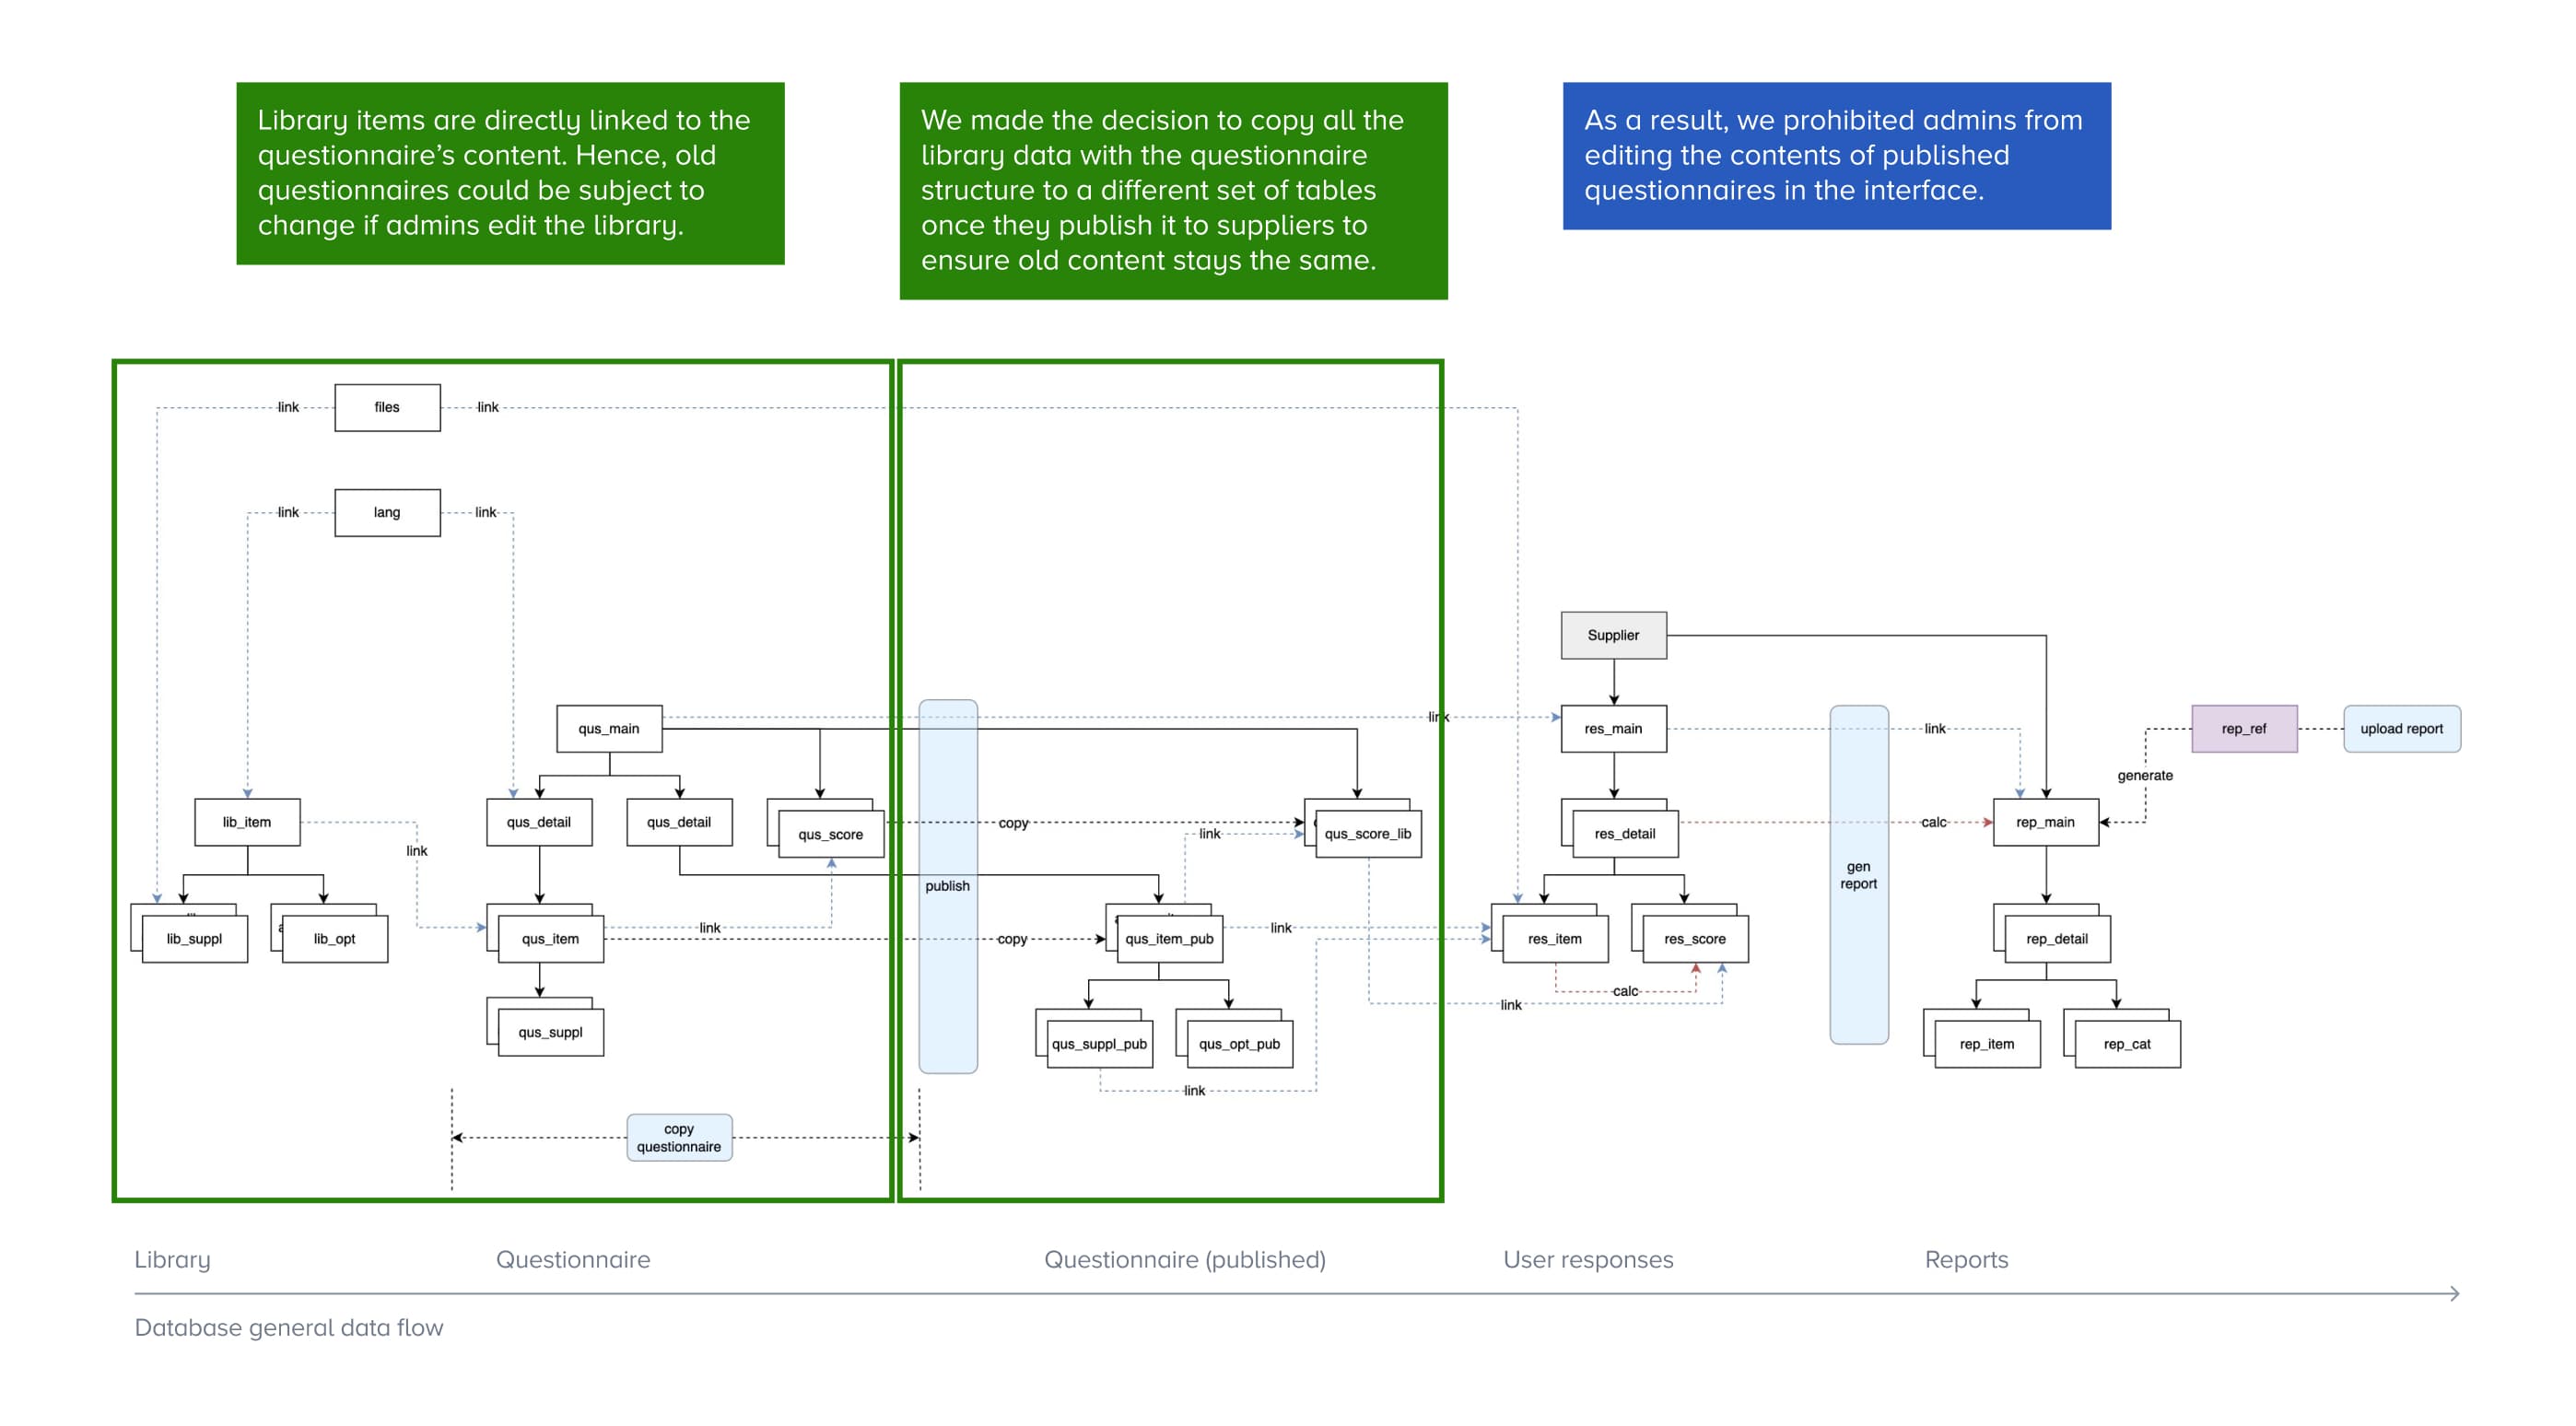
Influence of Data Structure on Design
Many of the design decisions were influenced by how we were able to structure our data. Since I was also the system analyst for the project, throughout the design process, I constantly considered the technical implementations for the system, and discussed with other system analysts and backend developers to ensure I was on the right track. The following graph shows the relationship for all the data tables, and an example of the influence it had on our design.
Afterthoughts
This was my first time participating in a project through the whole process. From holding interviews with the client, practicing UX design, database design, frontend development to end to end testing, I gained the invaluable experience of understanding the different perspectives of different roles, and learned a lot from my team members.